
What is Loki and Grafana?
Loki is a horizontally-scalable, highly-available, multi-tenant log aggregation system. It doesn’t index the contents of the logs, but also a set of labels for each log stream. Grafana transfers with built-in support for Loki, an open-source log aggregation system by Grafana Labs.
What is Promtail?
Promtail is an agent which ships the contents of local logs to a private Loki instance or Grafana Cloud. It is usually deployed to every machine that has applications needed to be monitored. It primarily: Attaches labels to log streams.
How to set up Loki?
- Firstly, download and install both Loki and Promtail.
- Then, download config files for both programs.
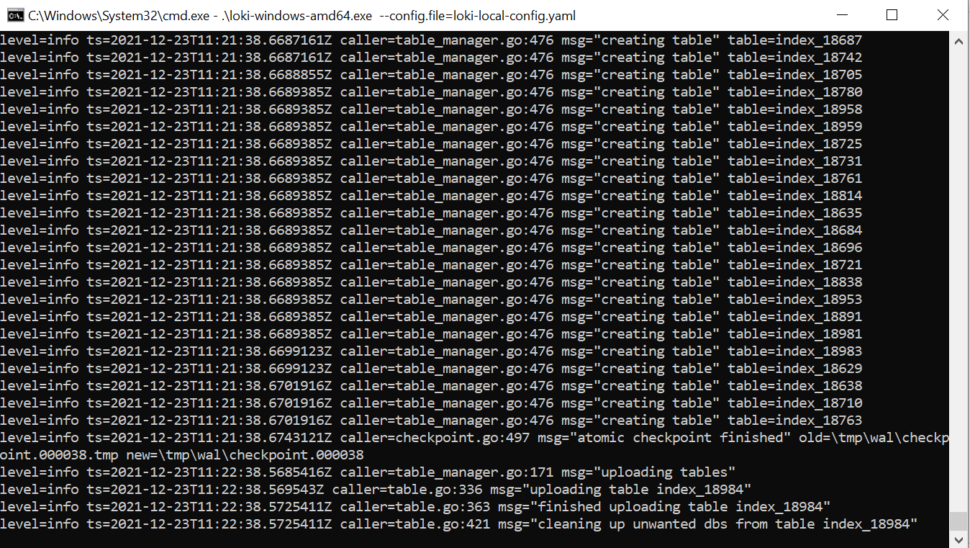
- Start Loki using command.
- Make the necessary changes in the Promtail config file to get your logs into Loki.
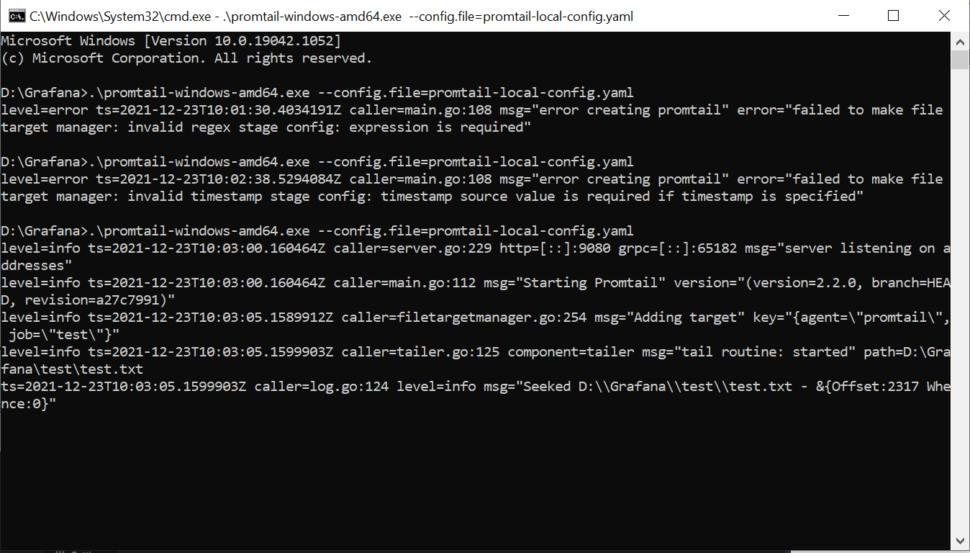
- Start Promtail using command.
To download Loki and promtail go to the following link https://github.com/grafana/loki/releases choose the below files
Copy paste the config file from the link below or copy-paste the block given below:
https://raw.githubusercontent.com/grafana/loki/master/cmd/loki/loki-local-config.yaml
https://raw.githubusercontent.com/grafana/loki/master/cmd/promtail/promtail-local-config.yaml
To install and run Loki locally use the following command
.\loki-windows-amd64.exe --config.file=loki-local-config.yamlTo install and run Promtail locally use the following command
.\promtail-windows-amd64.exe --config.file=promtail-local-config.yamlCreate a directory and add a sample log file, I’m using test.txt in txt format
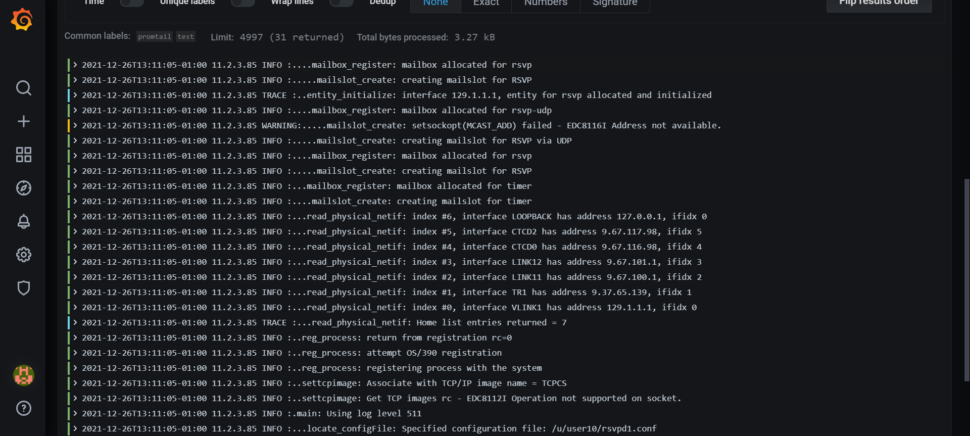
Below is the sample log file
2021-12-26T13:11:05-01:00 11.2.3.85 INFO   :.main: *************** RSVP Agent started ***************
2021-12-26T13:11:05-01:00 11.2.3.85 INFO   :...locate_configFile: Specified configuration file: /u/user10/rsvpd1.conf
2021-12-26T13:11:05-01:00 11.2.3.85 INFO   :.main: Using log level 511
2021-12-26T13:11:05-01:00 11.2.3.85 INFO   :..settcpimage: Get TCP images rc - EDC8112I Operation not supported on socket.
2021-12-26T13:11:05-01:00 11.2.3.85 INFO   :..settcpimage: Associate with TCP/IP image name = TCPCS
2021-12-26T13:11:05-01:00 11.2.3.85 INFO   :..reg_process: registering process with the system
2021-12-26T13:11:05-01:00 11.2.3.85 INFO   :..reg_process: attempt OS/390 registration
2021-12-26T13:11:05-01:00 11.2.3.85 INFO   :..reg_process: return from registration rc=0
2021-12-26T13:11:05-01:00 11.2.3.85 TRACE  :...read_physical_netif: Home list entries returned = 7
2021-12-26T13:11:05-01:00 11.2.3.85 INFO   :...read_physical_netif: index #0, interface VLINK1 has address 129.1.1.1, ifidx 0
2021-12-26T13:11:05-01:00 11.2.3.85 INFO   :...read_physical_netif: index #1, interface TR1 has address 9.37.65.139, ifidx 1
2021-12-26T13:11:05-01:00 11.2.3.85 INFO   :...read_physical_netif: index #2, interface
Open the file loki-local-config.yaml and make the below changes
#This is loki-local-config.yaml
auth_enabled: false

server:
  http_listen_port: 3100
  grpc_listen_port: 9096

ingester:
  wal:
    enabled: true
    dir: /tmp/wal
  lifecycler:
    address: 127.0.0.1
    ring:
      kvstore:
        store: inmemory
      replication_factor: 1
    final_sleep: 0s
  chunk_idle_period: 1h       # Any chunk not receiving new logs in this time will be flushed
  max_chunk_age: 1h           # All chunks will be flushed when they hit this age, default is 1h
  chunk_target_size: 1048576  # Loki will attempt to build chunks up to 1.5MB, flushing first if chunk_idle_period or max_chunk_age is reached first
  chunk_retain_period: 30s    # Must be greater than index read cache TTL if using an index cache (Default index read cache TTL is 5m)
  max_transfer_retries: 0     # Chunk transfers disabled

schema_config:
  configs:
    - from: 2020-12-22
      store: boltdb-shipper
      object_store: filesystem
      schema: v11
      index:
        prefix: index_
        period: 24h

storage_config:
  boltdb_shipper:
    active_index_directory: /tmp/loki/boltdb-shipper-active
    cache_location: /tmp/loki/boltdb-shipper-cache
    cache_ttl: 24h         # Can be increased for faster performance over longer query periods, uses more disk space
    shared_store: filesystem
  filesystem:
    directory: /tmp/loki/chunks

compactor:
  working_directory: /tmp/loki/boltdb-shipper-compactor
  shared_store: filesystem

limits_config:
  reject_old_samples: true
  reject_old_samples_max_age: 168h

chunk_store_config:
  max_look_back_period: 0s

table_manager:
  retention_deletes_enabled: false
  retention_period: 0s

ruler:
  storage:
    type: local
    local:
      directory: /tmp/loki/rules
  rule_path: /tmp/loki/rules-temp
  alertmanager_url: http://localhost:9093
  ring:
    kvstore:
      store: inmemory
  enable_api: true
Open the Promtail file promtail-local-config.yaml and make the below changes
#This is promtail-local-config.yaml
server:
  http_listen_port: 9080
  grpc_listen_port: 0

positions:
  filename: /tmp/positions.yaml

clients:
  - url: http://localhost:3100/loki/api/v1/push

scrape_configs:
- job_name: system
  pipeline_stages:

  - output:
      source: message

      action_on_failure: skip
  static_configs:
  - targets:
      - localhost
    labels:
      job: test
      agent: promtail
      __path__: D:/Grafana/test/*
Go to command prompt and run the below commands in seperate command prompts
.\promtail-windows-amd64.exe --config.file=promtail-local-config.yaml
.\loki-windows-amd64.exe --config.file=loki-local-config.yaml
Go to chrome and type http://localhost:3000
Default Username and Password is admin
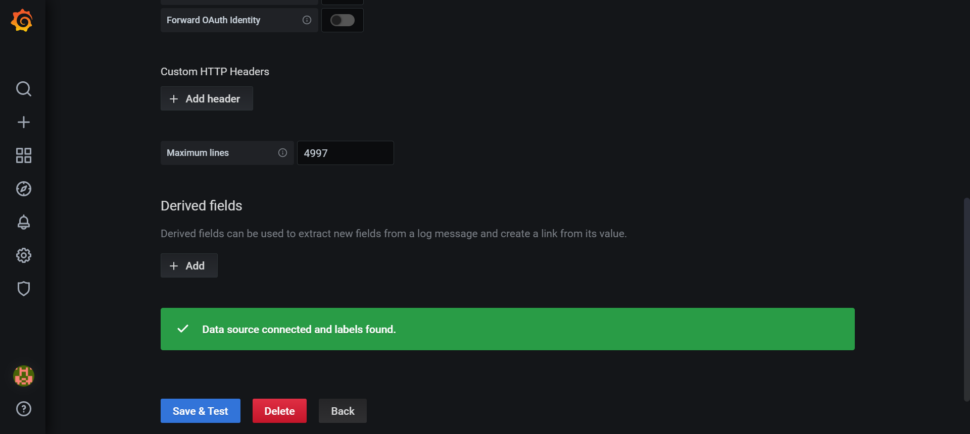
Go to Settings -> Configuration -> make Loki as a Default setting and add the URL http://localhost:3100
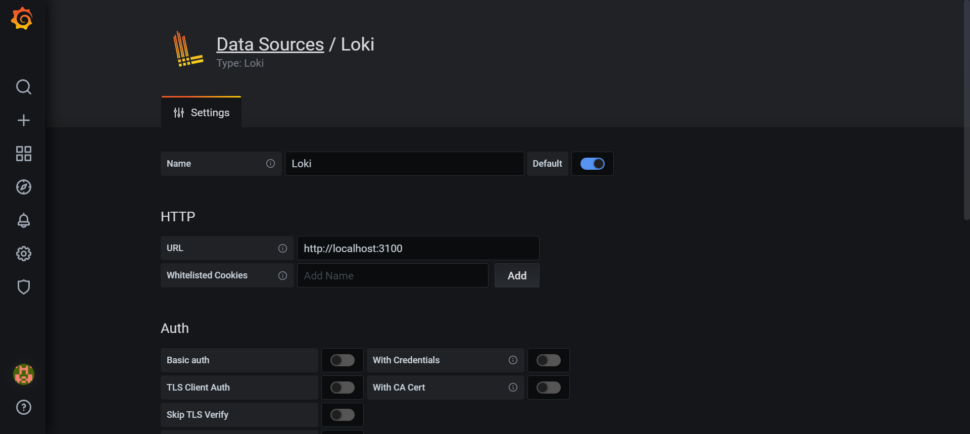
Save the changes
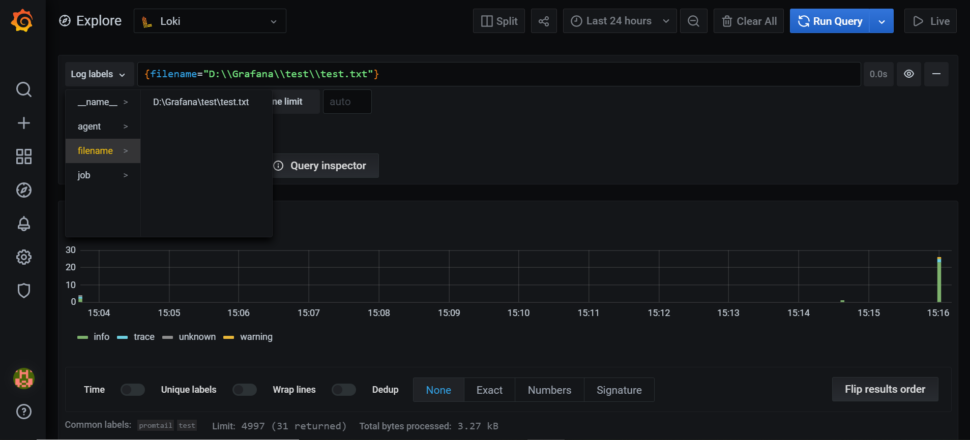
Go to Explore –> Log labels –> filename –> test.txt as shown below
This is how we upload logs from the local system to Loki in Grafana using the Promtail agent in the Windows system.
March 4, 2022Very helpful 👍👍