Monitoring the CPU and Memory utilisation of the windows servers is one of the important parameters to determine the application performance. With the help of the tools available in the market, we can monitor the server performance with ease.
Find the steps below to configure the monitoring tool on windows server/machine
Install a WMI tool.
- Download the latest version of WMI .msi tool from the below link
https://github.com/prometheus-community/windows_exporter/releases
- Click on the WMI.msi file and follow the instructions provided by the installer to install the tool.
- Goto Services option present under Task Manager to check if the windows_exporter service is running
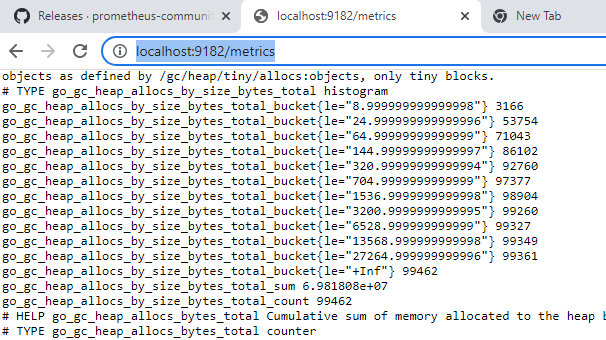
Access the URL http://localhost:9182/metrics to check if windows Metrix is being displayed. If yes, then the WMI tool is installed correctly.
Bind windows-exporter with Prometheus
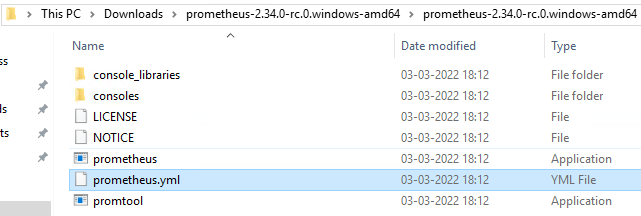
- Download the latest version of promanthese tool from the below link
https://prometheus.io/download/
- Extract the downloaded zip file and open prometheus.yml and add the following tags and save it
- job_name: "Wmi-exporter"
    # metrics_path defaults to '/metrics'
    # scheme defaults to 'http'.

    static_configs:
      - targets: ['localhost:9182']
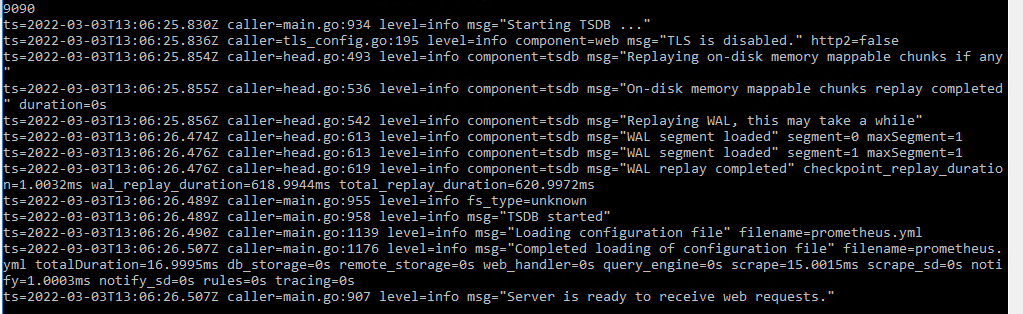
- Once you start the prometheus application, you can see a message stating that “Server is ready to receive web requests.”.
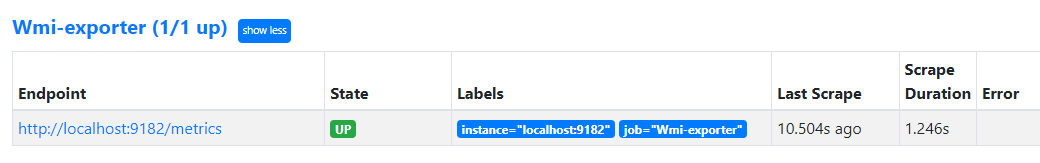
- Access the url http://localhost:9090/targets and check if Wmi exporter state is up and running.
Install Grafana and configure the windows monitoring dashboard
- Download the Grafana installer from the below link
https://grafana.com/grafana/download?platform=windows
- Click on the grafana-enterprise-8.4.3.windows-amd64.msi file and follow the instructions provided by the installer to install the tool.
- Access the url http://localhost:3000/login in the system, login with the default credentials username: admin and password: admin and change the password accordingly.
- After login, click on Add your first data source.

- Select Prometheus.Enter the URL: https://localhost:9090

- Scroll down and click on Save & test, message Data source is working should be displayed

- Click on import
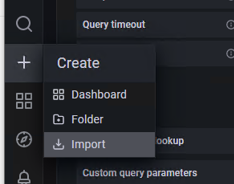
- Enter the dashboard ID: 14451 and click on load

- In the option, enter the name and select the configured data source
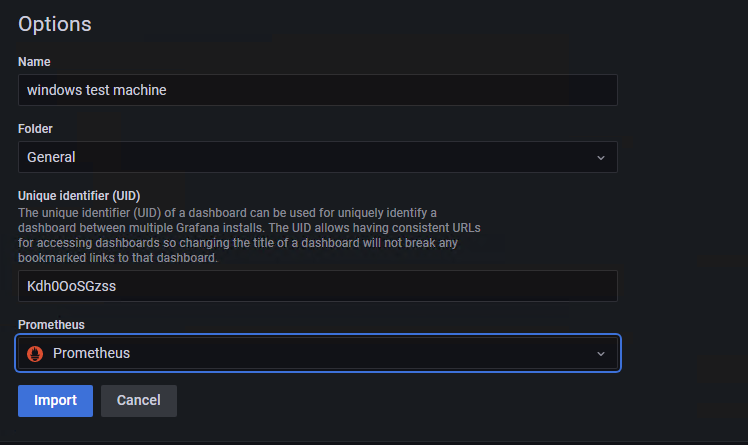
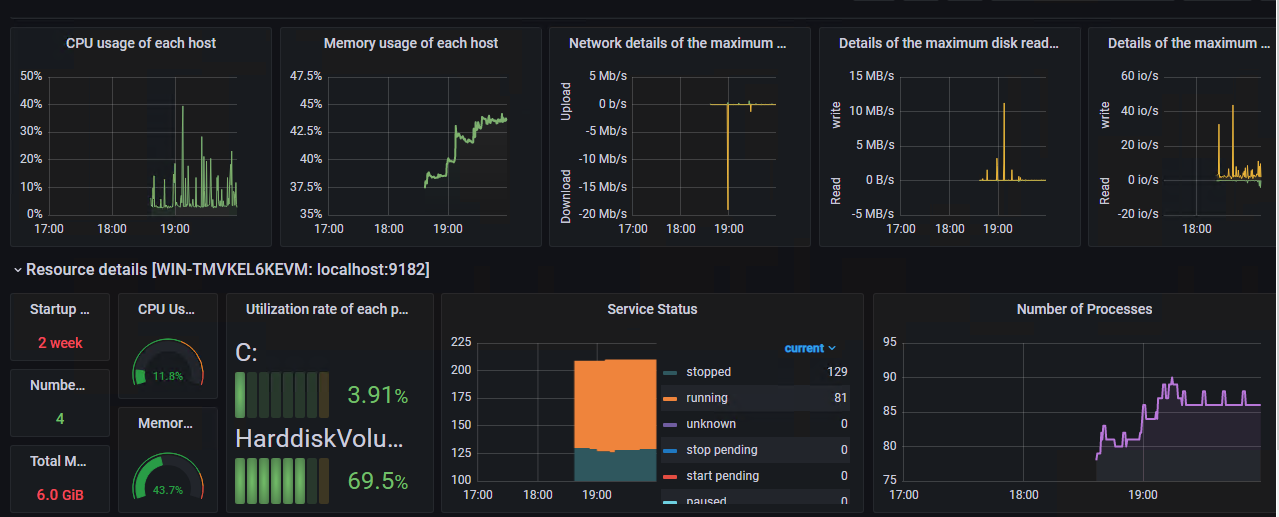
- Finally click on import and we should be able to see the CPU/Memory/Disk utilisation real time