
Table of contents
- Introduction
- Installation and setup
- Architecture and Configuration
- Building Dashboard
- Conclusion
Introduction
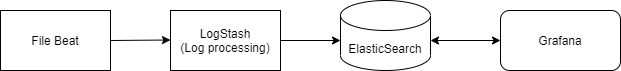
As Devops Engineer monitoring web application can be a tricky task and usually monitoring solutions have a steep learning curve .Today we will build an analytics solution for IIS based web application, we will be using ELG stack(Elasticsearch ,Logstash , Grafana) with addition of FileBeat. At the end of this blog you will have a Grafana dashboard which will give you visual insights about your web application.
Installation and setup
Before Starting you will need to install the ELG stack, Elasticsearch ,Logstash ,Grafana along with File beat. However this tutorial does not cover installation of ELG stack Installation instructions given on the official websites are sufficiently easy to follow . secondly make sure you Install filebeat on the machine where the web application is deployed . Whereas Logstash , Elasticsearch and Grafana should be installed on separate machine(s) . At last you will also have to enable IIS logs on your web application server refer to this tutorial.
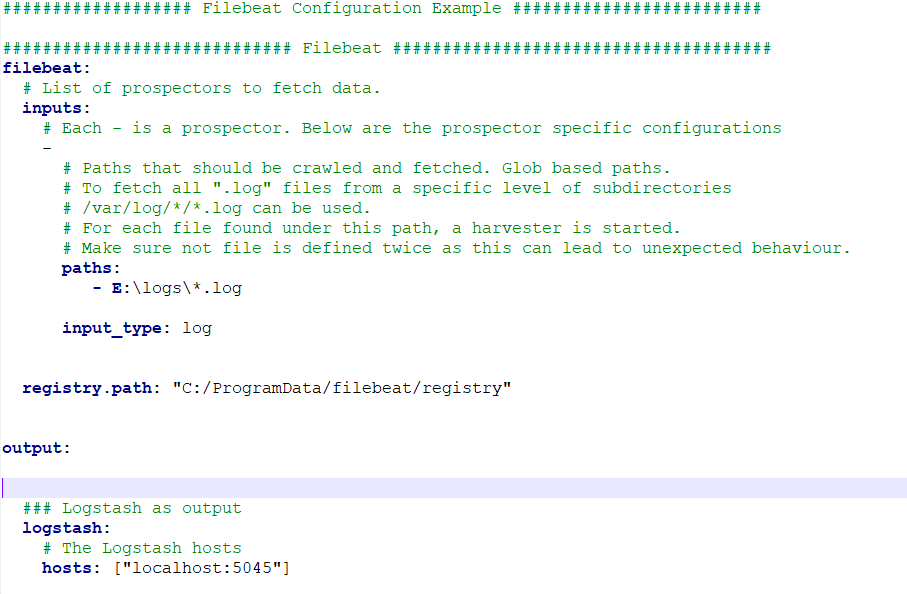
Firstly we need to configure Filebeat to take input from the IIS Log folder and output it to the Logstash server, For this go to Filebeat installation directory Edit the Filebeat.yml.
Similarly we configure Logstash which is the heart of our data pipeline which will take input from filebeat parse the logs according to defined grok pattern and convert into elastic document and insert into elasticsearch , For this we edit logstash.conf file present in logstash config folder.
input {
  beats {
    port => 5045
    type => 'iis'
  }
}


# First filter
filter {
  #ignore log comments
  if [message] =~ "^#" {
    drop {}
  }

  grok {
    patterns_dir => "./patterns"
    match => ["message", "%{TIMESTAMP_ISO8601:timestamp} %{IPORHOST:ip} %{WORD:method} %{NOTSPACE:request} %{NOTSPACE:querystring} %{NUMBER:port} %{NOTSPACE:username} %{IPORHOST:clientip} %{NOTSPACE:agent} %{NOTSPACE:referer} %{NUMBER:response} %{NUMBER:sub_response} %{NUMBER:sc_status} %{NUMBER:responsetime}"]
  }
  date {
    match => [ "timestamp", "yyyy-MM-dd HH:mm:ss" ]
	timezone => "Etc/UTC"
  }
}


# Second filter
filter {
  if "_grokparsefailure" in [tags] {

    } else {
    # on success remove the message field to save space
    mutate {
      remove_field => ["message","timestamp"]
	 convert => ["response", "integer"]
	 convert => ["responsetime", "integer"]
    }
  }
}

output {
  elasticsearch {
    hosts =>  ["127.0.0.1:9200"]
    index => "logstash-%{+YYYY.MM.dd}"
  }
}
Make sure to change grok parser according to your IIS log file , good place to debug grok patterns is this. Notice the format of the elastic index, this format tells logstash to create a new index daily.
Congratulations you have finished all the configuration tasks (Elasticsearch doesn’t need any change, default config will work). Now we have to start up all the required endpoints in order of Elastic, Logstash, Filebeat. For Elasticsearch open terminal in installed binary directory and type elasticsearch. For Logstash go to the directory of Logstash and in command prompt type .\bin\logstash.bat -f .\config\logstash.conf to start FileBeat go to installation directory open command prompt and type filebeat.exe. (In final production deployment each application should run as a service )
Building Dashboard
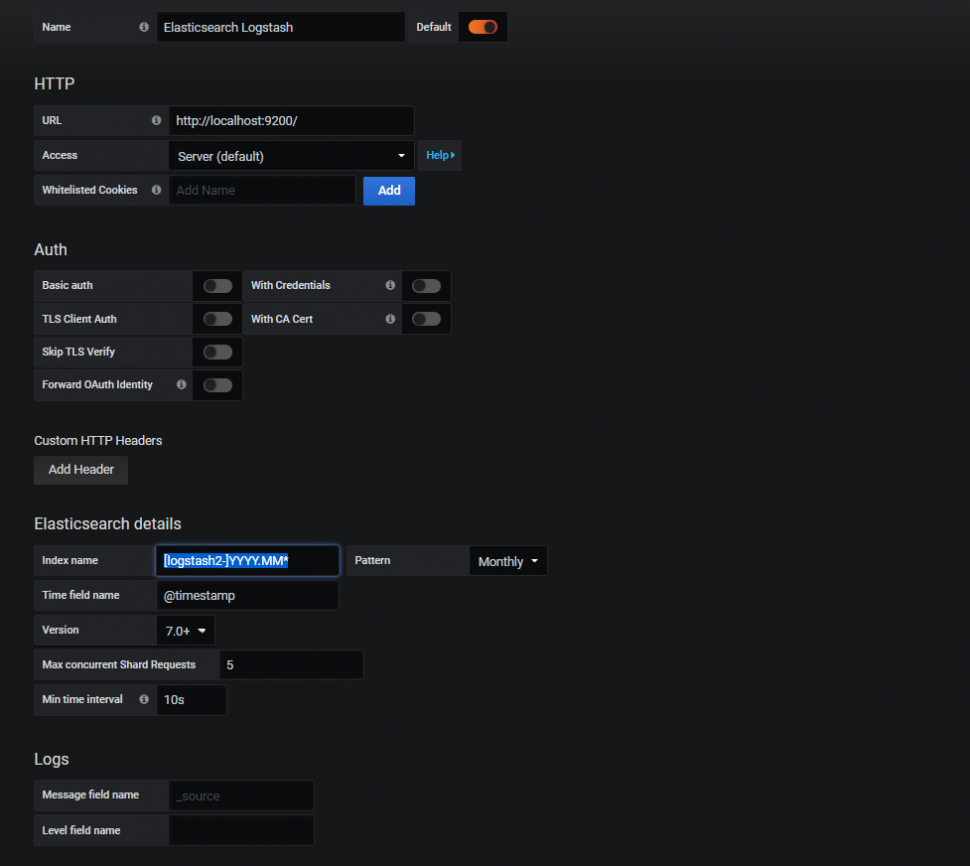
This is the final part of the tutorial where we build a dashboard to get more insight from the data we pushed to Elasticsearch. For that we will have to add Elastic as a datasource to grafana open grafana url (usually the url is localhost:3000) and add navigate to datasources.
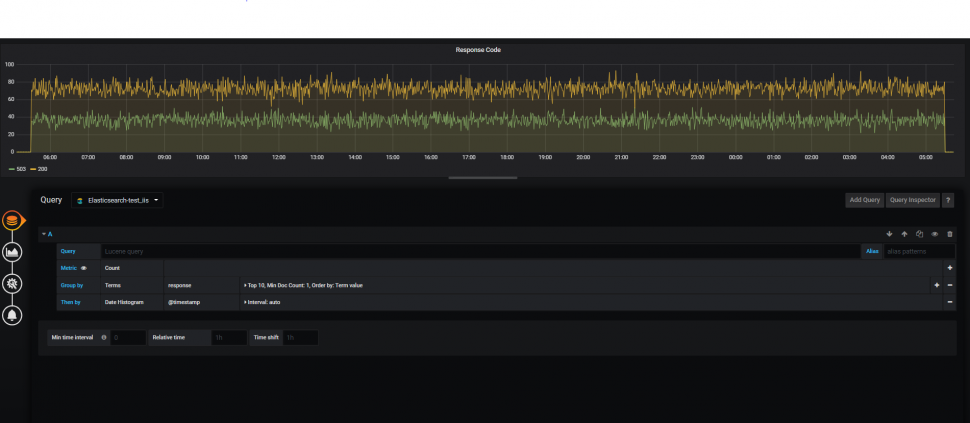
Create new Dashboard and add new panel and fill as shown below
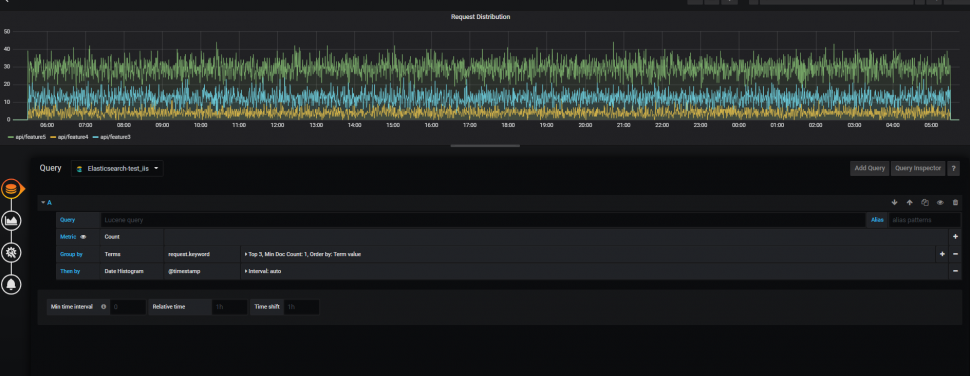
Second panel is to get Request distribution
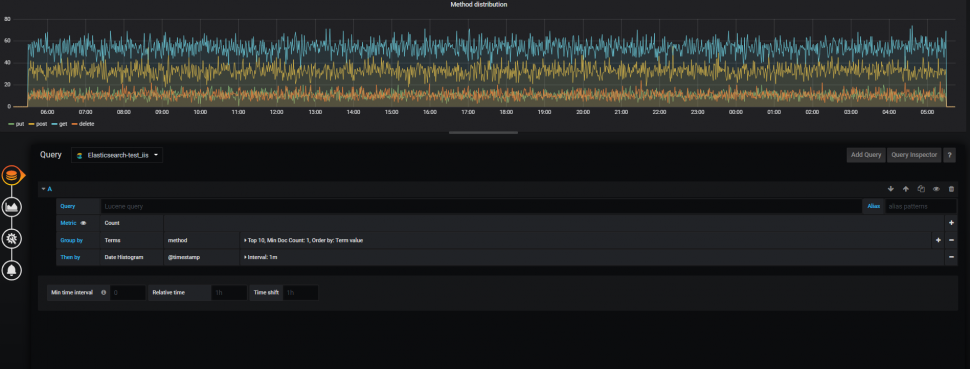
third panel is to get method type distribution
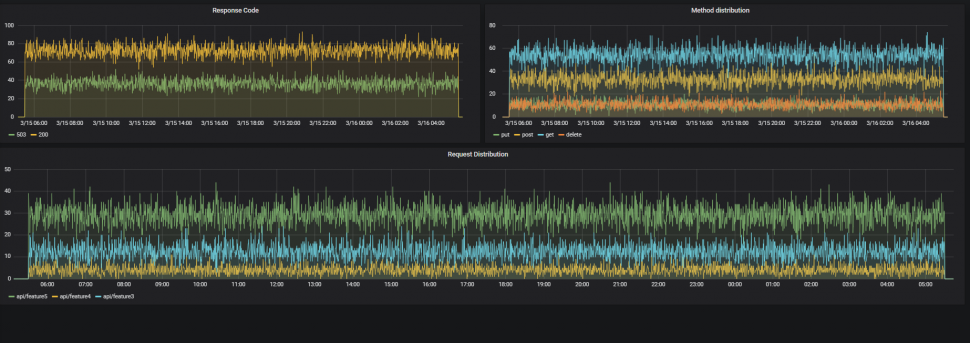
Final Dashboard
Conclusion
Finally we have reached the end of this tutorial , today we learnt how to get started with ELG stack and built a basic analytics solution for IIS based web application . You can add more panels according to your requirement for more insights of your web application.