
Hi Folks! In this blog, we will learn about MQTT monitoring in the Grafana console.
This blog will help us to track the real-time usage of HiveMQ brokers. We can track multiple important metrics like active subscriptions, messages per second, data per topic and many more which can help us to increase the productivity of the system.
Prerequisite
1) HiveMQ Broker
2) Prometheus
3) Grafana
Extension Installation
If we draw the architecture of the system then it will look like, the HiveMQ broker extension submits real-time data to the Prometheus database and Grafana will use and display these metrics in their console.
To insert real-time data to Prometheus we have to download and configure HiveMQ Prometheus Monitoring Extension. Installation of this plugin is easy and the same as other extensions. After downloading, extract the zip file and copy hivemq-prometheus-extension folder to the extensions folder of the HiveMQ broker.
Inside hivemq-prometheus-extension folder there is one properties file called prometheusConfiguration.properties. The configuration file will contain the below properties:
host: The host address where we want to run the servlet
port: The port number on which we want to run the servlet
metric_path: The path where we want to expose HiveMQ metrics. Prometheus will use the host, port and path to insert data.
Dashboard Configuration
Our real-time metrics are inserted into the Prometheus database. Now, it’s time to use these metrics and get insightful values from them. Open Grafana console if you don’t know how to install then please refer to Install Grafana.
Once you open the Grafana console, Select Configuration and then Data sources. Once you select Data sources then select Add data source and select Prometheus from the data source and enter the URL on which Prometheus service is running and click on Save.
Now, our Prometheus data source is added successfully. To monitor metrics we need the Grafana dashboard. We can create a dashboard from the scratch as per our need or we can import a dashboard template. We can download and import HiveMQ Grafana Dashboard.
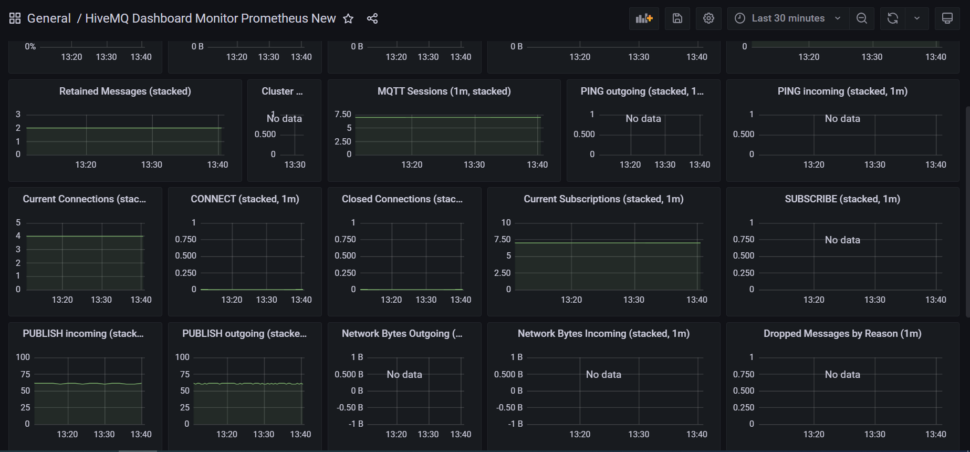
That’s it! Now we have a working dashboard that will display our metrics and help us to monitor MQTT deployments.