
The Android Profiler is nothing but a replacement for Android Monitor tools in Android Studio 3.0 and higher. Android Profiler tools get real-time app data which helps to understand how your app uses CPU, memory, network, and battery resources.
How to enable Android Profiler
- Enable inbuild profiler in android studio
View > Tool Windows > Profiler
- Enable StandAlone profiles
- Windows OS
<studio-installation-folder>/bin run profiler.exe - MacOS
<studio-installation-folder>/Contents/bin run profiler.sh
- Windows OS
It will show the below profile window
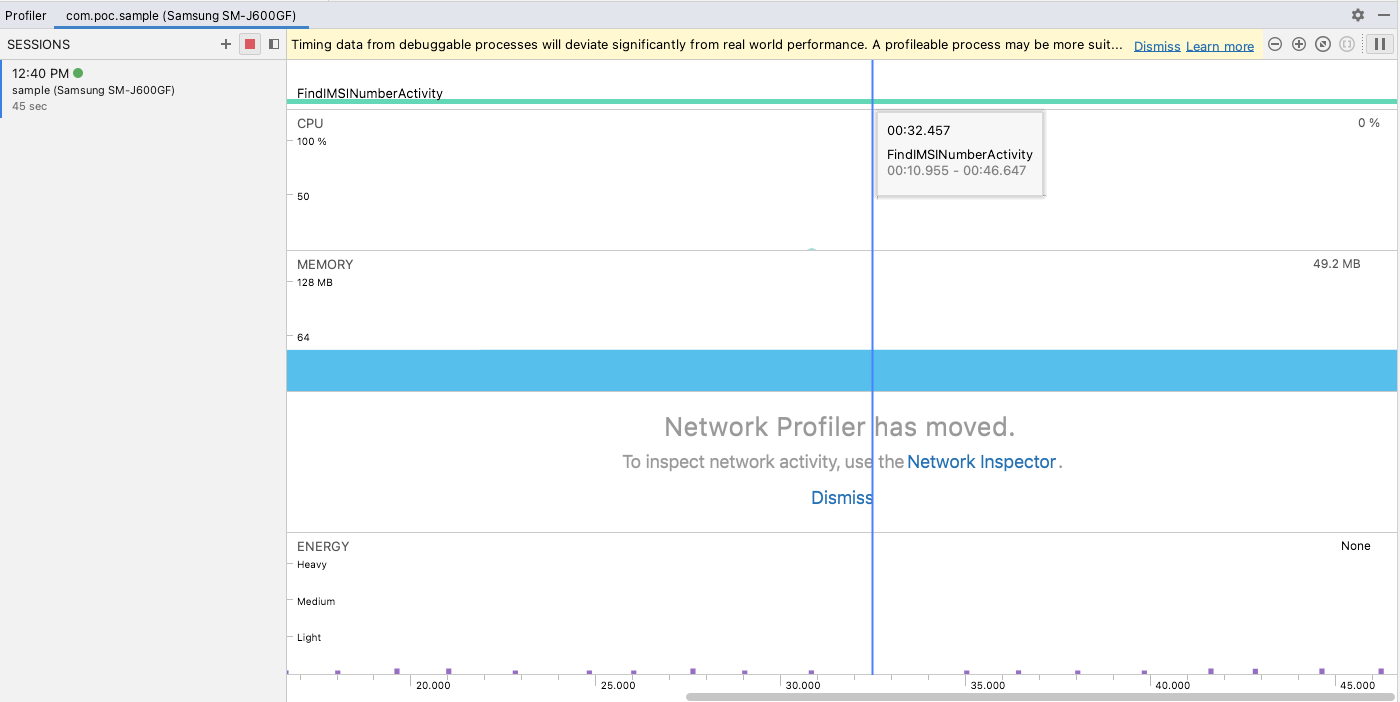
We can inspect four different resources using an Android Profile.
- CPU Profiler
- Memory
- Energy (Battery)
- Network
We will see the CPU profiler in detail, CPU Profiler is used to inspect usage and thread activity in real-time while using the app. We can also check below the specific details while using an application.
- Method and function traces
- System traces
Start CPU Profiler
We can enable the CPU profiler by clicking anywhere on the CPU section in the profiler tab. It will show below the details view for the CPU usage.
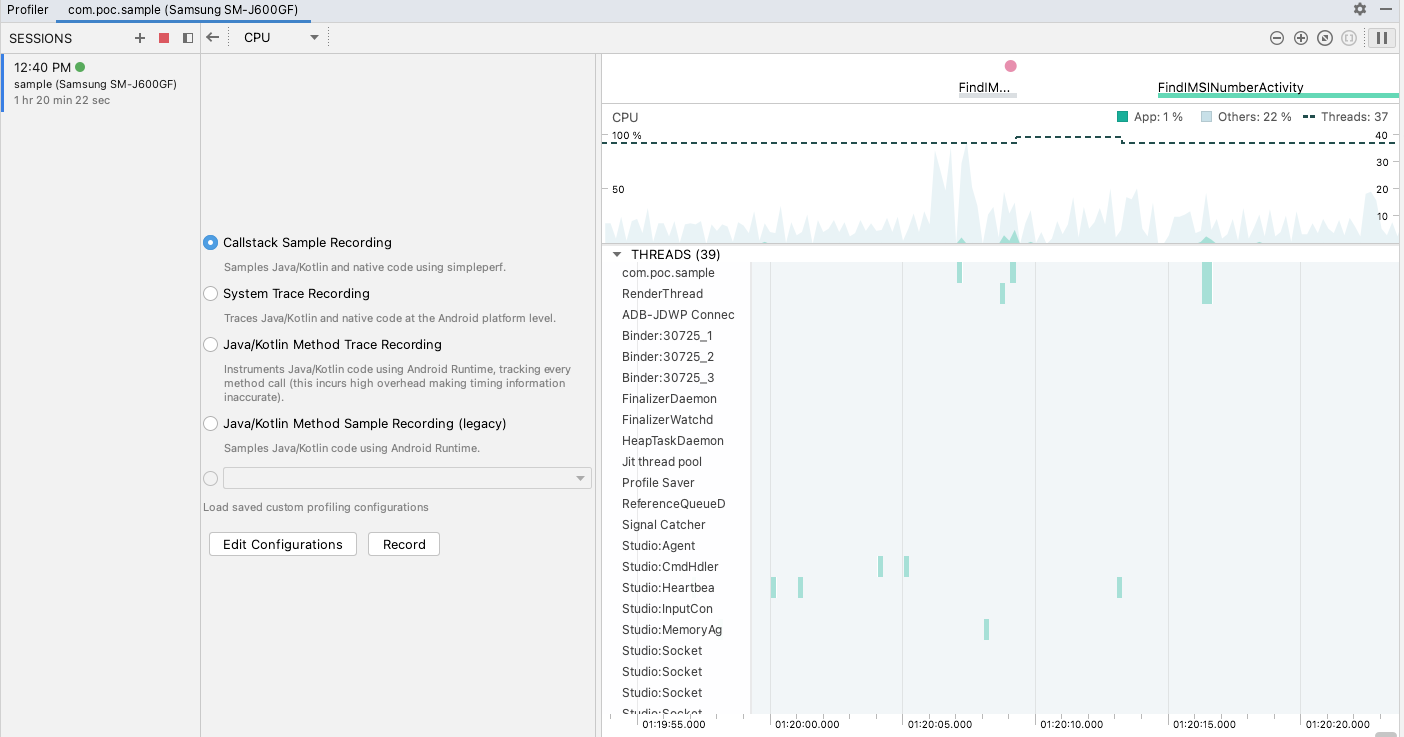
In the above image,
- The top right section is showing interaction with the app, we can see the CPU usage concerning our app activity.
- Below the app CPU interaction section, there is a thread list with the status of that thread. You can click on the top of the thread and check its status based on respect to that time duration and based on the status of the thread shows the color bar for example
- Green: The thread is active or is ready to use the CPU means it’s in a running or runnable state.
- Yellow: The thread is active, but it’s waiting for some resources to get available to complete the task.
- Gray: The thread is sleeping means it’s not consuming any CPU time.
- Left side there are multiple recording options available in the CPU profiler for tracing CPU usage.
Start recording:
We can choose the appropriate recording option and start recording. A profiler will start recording that option in detail and start updating a result as shown in the below result.
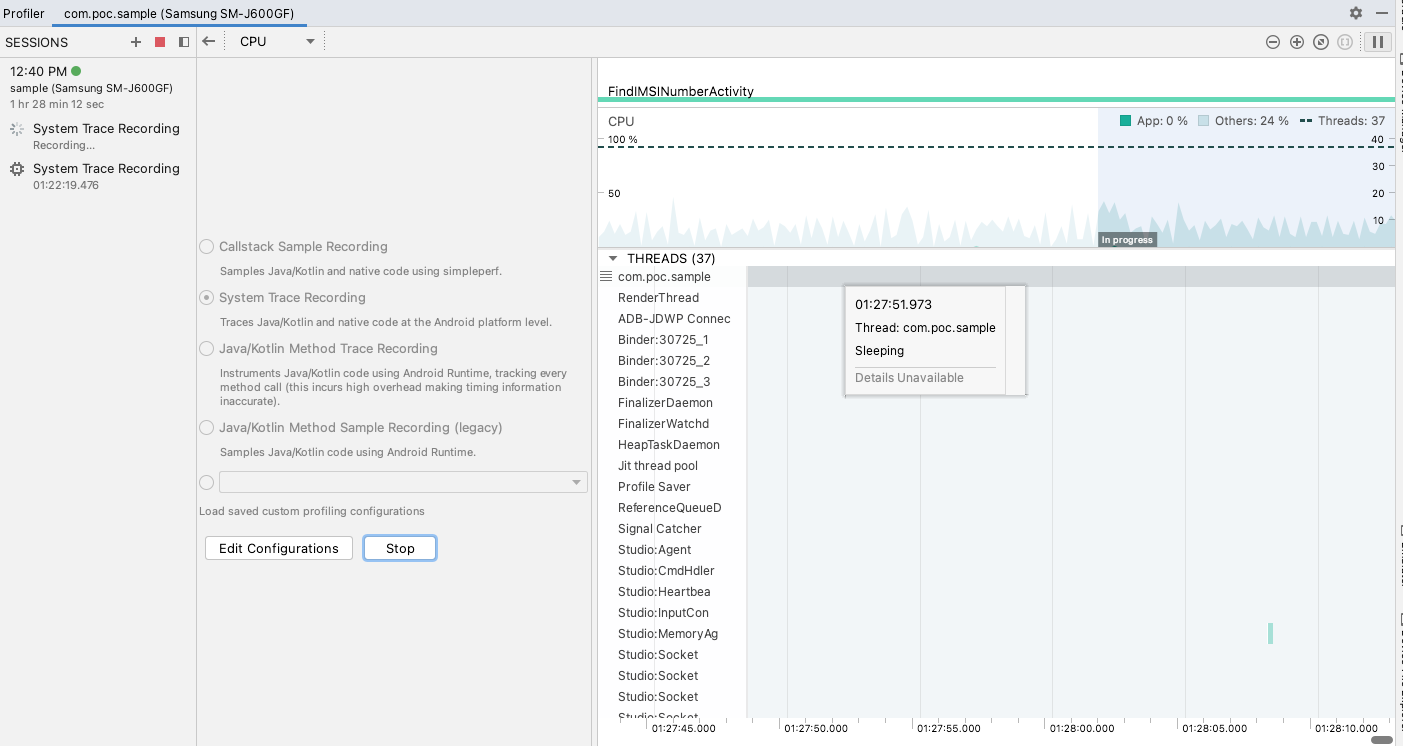
Let the system record a details interaction with an app while it’s in use, once you are done with that press stop to check the details report.
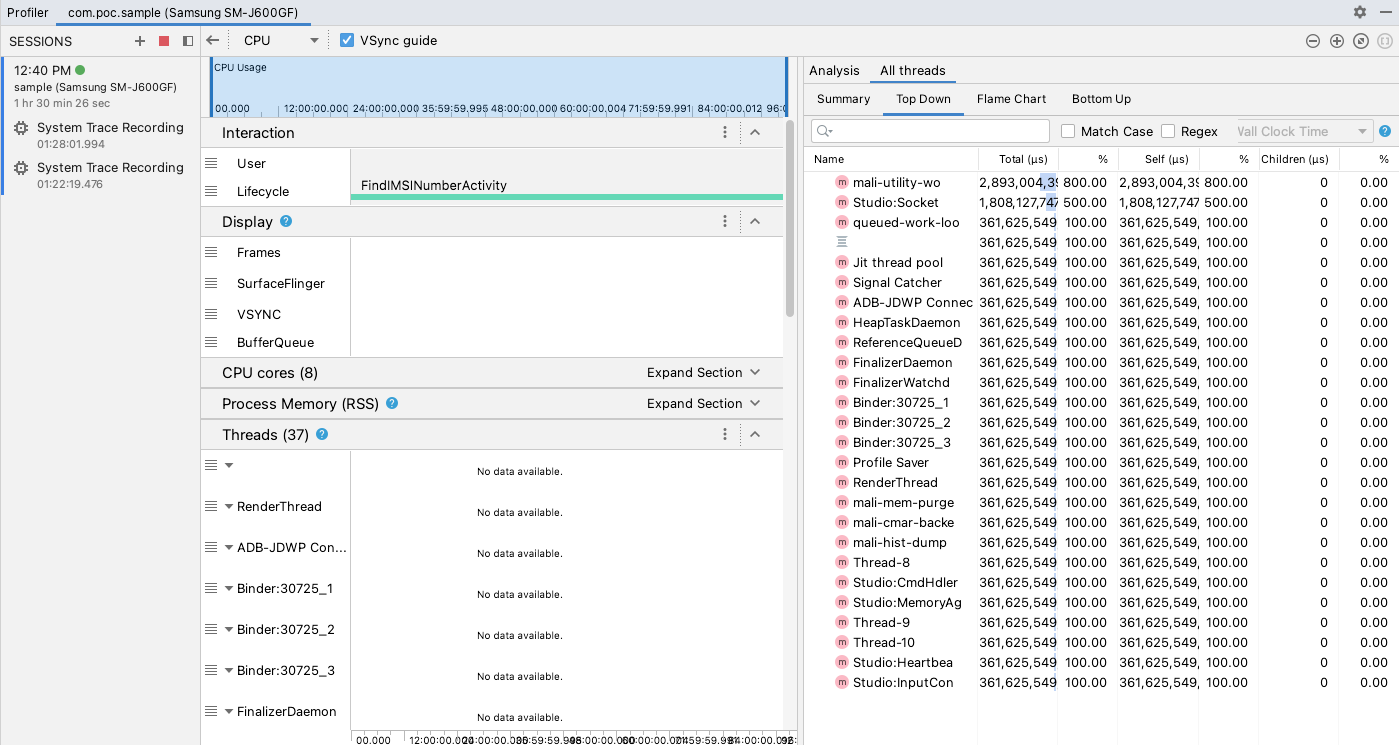
In the above image, you can see details report of the System Trace recording. Here profiler has recorded how your app interacts with system resources.
Here you can see the right side list of method which is invoked and the time taken to complete the execution. There are three shorting types of viewing the methods and executed while recording.
- Top-down
- Botton Up
- Flame chart
Let’s see one example of a recording of the app methods
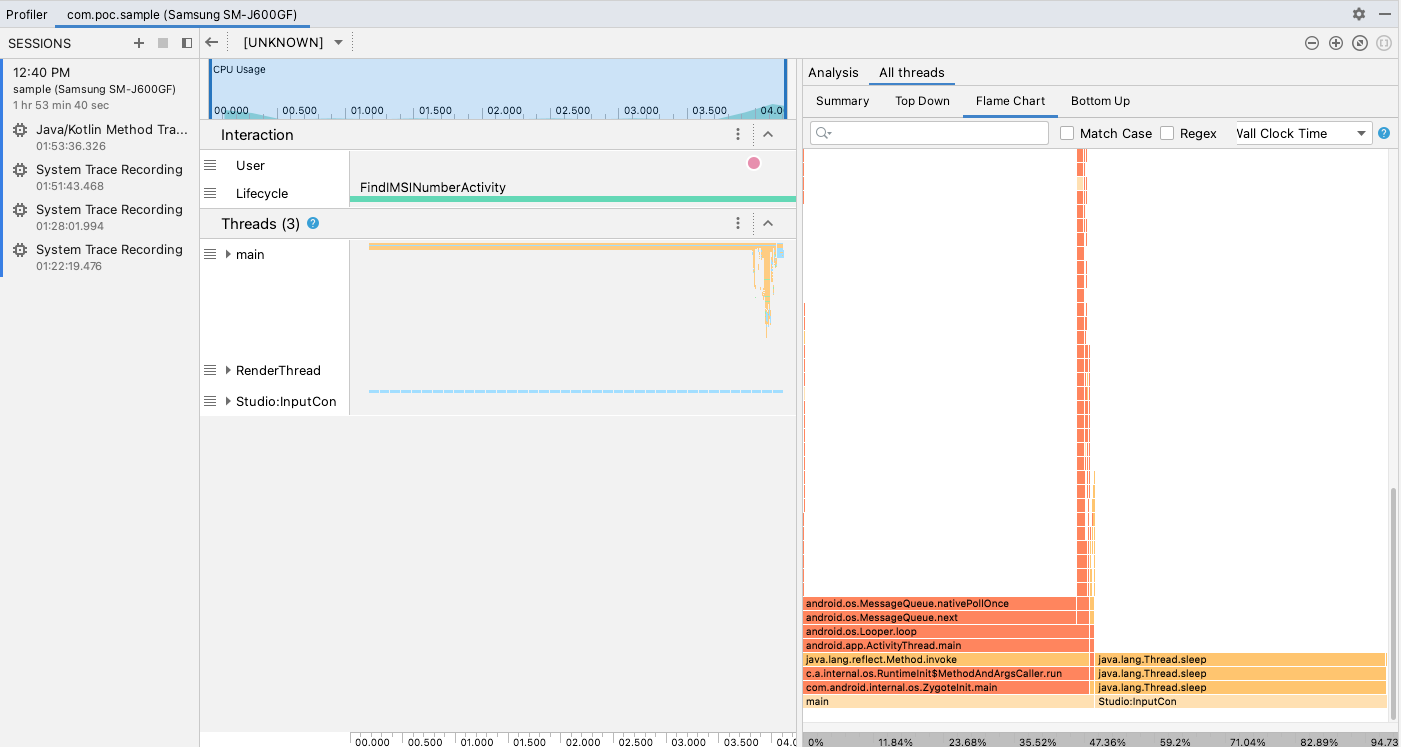
Here we can see the different colors for the method which is based on method type like it’s our application method, Java method, or native method.
How to enable recording for a particular feature or task programmatically.
Sample Java/Kotlin Methods → record your app’s call stack at frequent intervals during your app’s Java/Kotlin-based code execution. The profiler use sets of data to get the timing and resource usage info about your app’s Java and Kotlin-based code execution.
Trace Java Methods → Record a timestamp at the beginning and end of each method call. Timestamps are used to generate methods including timing information, tracing data, and CPU usage.
Programmatically we can start tracking using
Debug.startMethodTracing()
And end using
Debug.stopMethodTracing()
Sample C/C++ Functions → Captures traces of your app’s native threads.
Programmatically we can start tracking using
Debug.startNativeTracing()
And end using
Debug.stopNativeTracing()
Trace System Calls → Captures details that allow you to inspect how your app interacts with system resources.
Programmatically we can start tracking using
Trace.beginSection(“Sample”);
And end with
Trace.endSection();