In general, to see resources utilization we use task manager in the windows operating system. But when it comes to detailed monitoring, performance is a good option. Here we are going to see how to monitor performance of an application using a performance monitor.
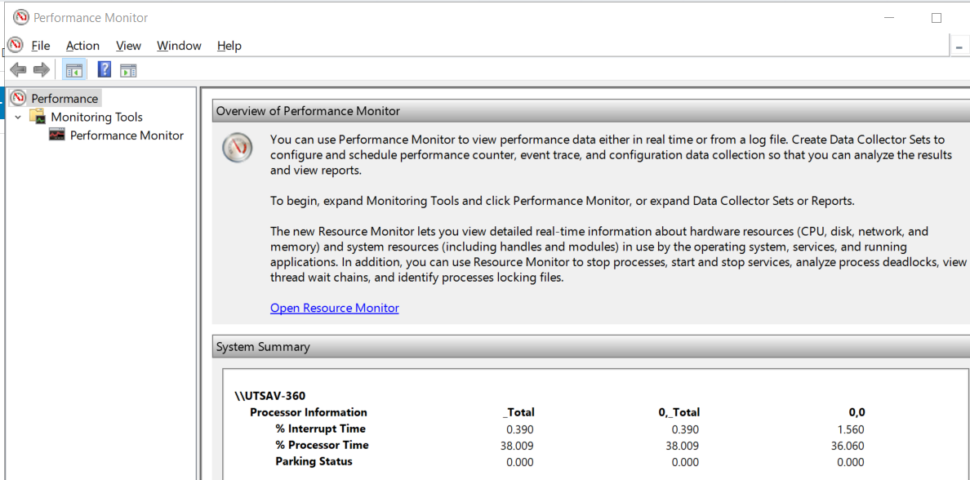
To access it, in the windows button and just write performance monitor. And select the first result which appears. The first window itself lists resource usage statistics such as physical disk, process information, etc..
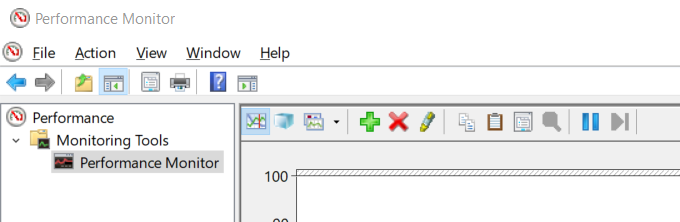
Now we are going to configure statistics for the application which will provide more detailed information of resources such as processor performance, application performance etc.. Opened the performance monitor window, in that select the performance monitor option ( performance > monitoring tools > performance monitor ).
In that window, press + button(green color). It will open another added counter window.
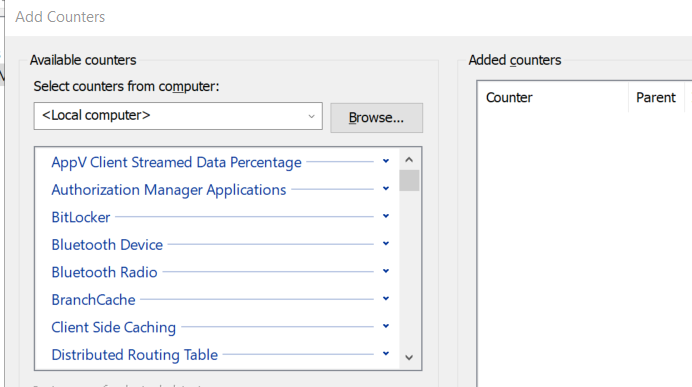
Yes, these are the parameters which we are looking for. Here for example, select a counter for the processor. By clicking on the processor. It will list processor parameters such as C1 time, C2 time, C3 time, idle time, etc..
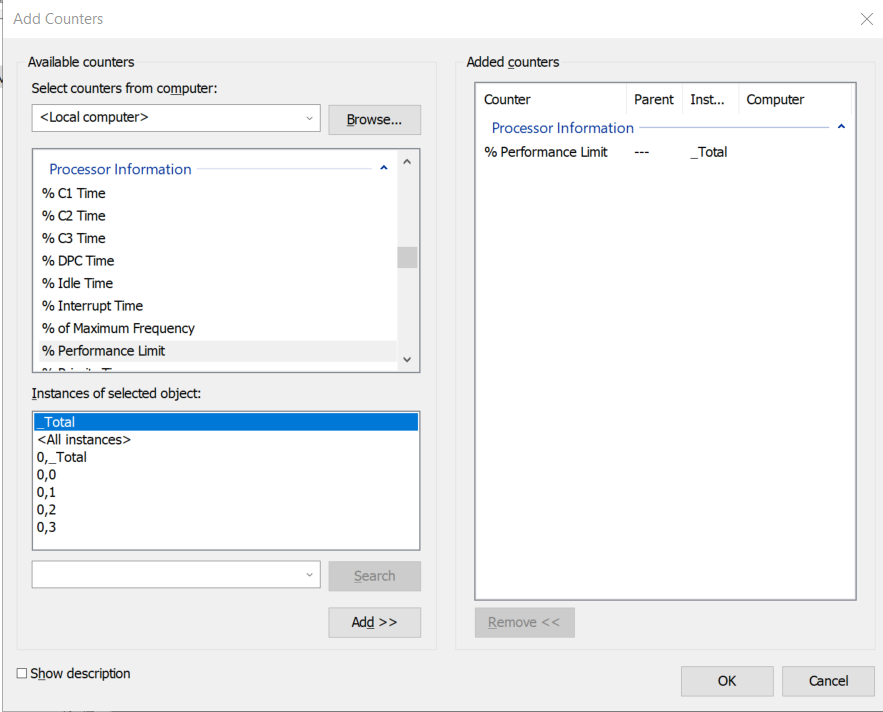
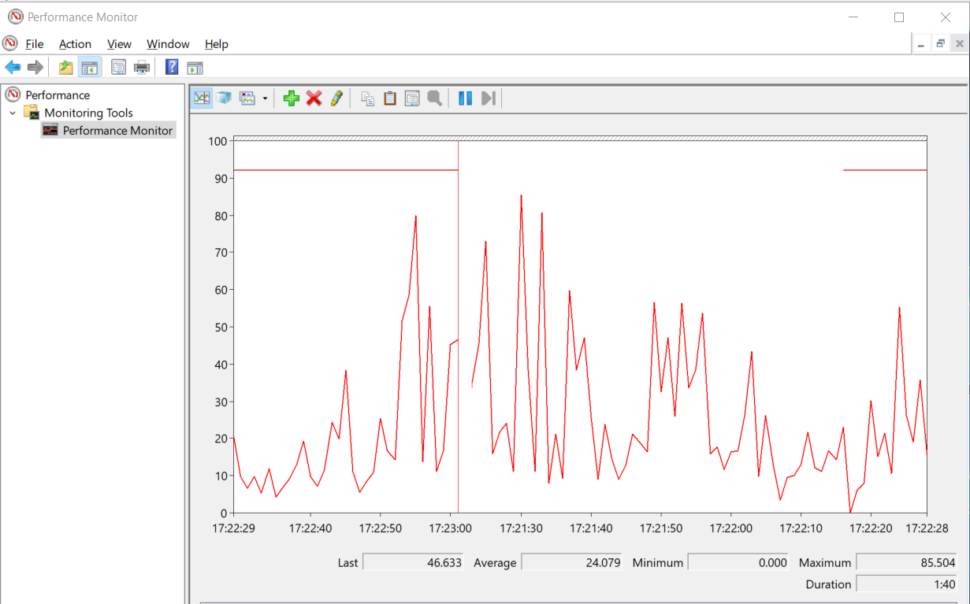
We are going to select (for multiple options use Ctrl button ) processor time and press Add button and finally click. It has started representing metrics in that window for selected parameters. Finally we are getting detailed metrics.