
SQL Server manages its memory requirements dynamically. Meaning, SQL Server will consume as much memory as available.
In other words, if you have deployed SQL Server on a machine with 4GB RAM, SQL Server will consume all the RAM available in the system, gradually. However, if you upgrade the same machine to 8GB RAM, SQL Server will consume the additional RAM and exhaust the complete 8GB.
So, how do you determine if your SQL Server really needs more RAM? How much RAM will SQL Server need? How much memory is normal for SQL Servers? Is SQL Server really lacking memory? How do I prove that SQL server needs more memory? How to identify SQL Server’s memory bottlenecks?
You might encounter such questions while troubleshooting performance issues due to SQL Server in production. The memory requirement for SQL Server purely depends on your database schema, your query structure and current load.
Performance Counter
Performance counters are the best way to monitor your SQL server internal metrics. In this blog, I will list down some important and some not-so-important performance counters that can be used to identify memory or performance issues in SQL server
SQL Server: Buffer Manager – Page Life Expectancy
Page Life Expectancy is probably the most important performance counter to consider here. It represents the number of seconds a page will stay in cache. Higher this value, the better SQL Server will perform. Lower values means high IO operations, which points out that you need more RAM for the cache. For good performance this value should be above 300 in a machine with 4 GB RAM.
SQLServer: Memory Manager – Memory Grants Pending
Memory Grants Pending is the next most important performance counter to consider here. It represents the total number of SQL processes or SQL queries that are waiting for memory to be granted. Lower this value, the better SQL Server will perform. For best performance, this value should be 0 most of the times. Consistent value greater than 1 demotes memory shortage.
SQL Server: Buffer Manager – Buffer Cache Hit Ratio
Buffer Cache Hit Ratio represents the percentage of times the page was found in cache. Higher this value, the better SQL server will perform. Lower values means high IO operations, which points out that you need more RAM for the cache. For good performance this value should be 98 or above. If the value is less than 90, the SQL server is under memory stress.
SQLServer: General Statistics – Processes blocked
“Processes blocked” is not directly related to SQL Server’s memory, but it is worth mentioning because it is the most useful performance counter to detect performance issues in SQL Server. It represents the total number of processes that are blocked. The processes can be blocked due to a SQL lock, memory shortage, IO throttling or various other reasons. Lower the value, the better your SQL queries will perform. Ideal value for this counter is 0.
Summary of Counters (with additional useful counters)
| Performance Counter | Trend | Expected Value for Best Performance | Explanation |
|---|---|---|---|
| SQLServer:Buffer Manager\Page life expectancy | Higher is better | > 75 * [System RAM in GiB] | Sudden drop in values are Ok |
| SQLServer:Memory Manager\Memory Grants Pending | Lower is better | 0 | Consistent value of 2 or higher means more RAM is needed |
| SQLServer:Buffer Manager\Buffer cache hit ratio | Higher is better | > 98% | < 90 means add more RAM |
| Memory\Pages/sec | Lower is better | < 50 | You can ignore this value during backup or restoration. |
| Paging File(_Total)\% Usage | Lower is better | < 50 | > 60% indicates external memory pressure |
| Memory\Page Faults/sec | Lower is better | < 50 | High value means other processes might be affecting SQL server performance |
| Process(sqlservr)\Page Faults/sec | Lower is better | < 50 | High value represents excessive paging in SQL Server |
| SQLServer:Memory Manager\Total Server Memory (KB) | Close to Target Server Memory | ~ Target Server Memory | Large difference means you have either allocated too much or too less RAM |
| Memory\Available MBytes | Higher is better | > 200 MB | Low value means other processes might be affecting SQL server performance |
| SQLServer:Buffer Manager\Lazy writes/sec | Lower is better | < 20 | High value represents many dirty pages are flushed from buffer pool to disk, meaning low buffer space |
| Free List Stalls/sec | Lower is better | 0 | Value more than 3 represents requests being suspended due to low buffer |
| SQLServer:Buffer Node(xxx)\Page life expectancy | Higher is better | > 75 * [Node’s RAM in GiB] | Same as Buffer Manager\Page life expectancy, but for SQL Server with multiple NUMA nodes |
| SQLServer:General Statistics\Processes blocked | Lower is better | 0 | High value represents too many queries are blocked to acquire additional resources. |
| SQLServer:SQL Statistics\SQL Compilations/sec | Lower is better | < 20% of Batch Requests/sec | High value represents too many ad hoc queries |
| SQLServer:Buffer Manager\Page lookups/sec | Lower is better | < 50 | Value more than 100 represents too many ad hoc queries and insufficient execution plans |
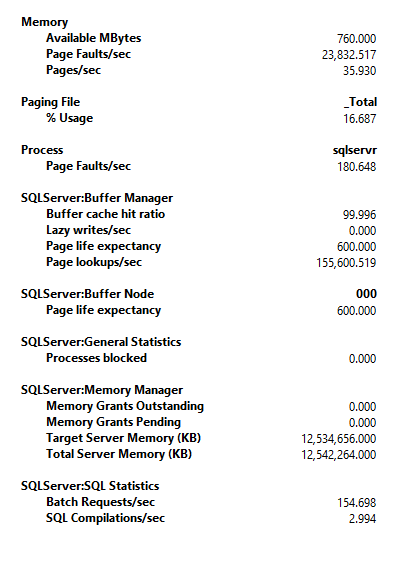
Perfmon View
Sample view of performance counters on a SQL Server machine:
To learn more about setting up performance counter monitor on Windows Server machine, read this blog: https://www.mssqltips.com/sqlservertip/6933/windows-performance-monitor-sql-server-introduction/